Task1&Task2 数据读取与数据分析
Task1&Task2 数据读取与数据分析
赛题数据是文本数据,每个新闻是不定长的,使用csv格式进行存储。因此可以直接用Pandas完成数据读取的操作。
import pandas as pd |
pd.read_csv常用参数: - 读取的文件路径,这里需要根据改成你本地的路径,可以使用相对路径或绝对路径; - 分隔符sep,为每列分割的字符,设置为\t即可; - 读取行数nrows,为此次读取文件的函数,是数值类型(由于数据集比较大,可以先设置为100);
train_df.head(5) |
| label | text | |
|---|---|---|
| 0 | 2 | 2967 6758 339 2021 1854 3731 4109 3792 4149 15... |
| 1 | 11 | 4464 486 6352 5619 2465 4802 1452 3137 5778 54... |
| 2 | 3 | 7346 4068 5074 3747 5681 6093 1777 2226 7354 6... |
| 3 | 2 | 7159 948 4866 2109 5520 2490 211 3956 5520 549... |
| 4 | 3 | 3646 3055 3055 2490 4659 6065 3370 5814 2465 5... |
同样的方法加载测试集数据。
test_df = pd.read_csv(r'test_a.csv', sep='\t') |
test_df.head(5) |
| text | |
|---|---|
| 0 | 5399 3117 1070 4321 4568 2621 5466 3772 4516 2... |
| 1 | 2491 4109 1757 7539 648 3695 3038 4490 23 7019... |
| 2 | 2673 5076 6835 2835 5948 5677 3247 4124 2465 5... |
| 3 | 4562 4893 2210 4761 3659 1324 2595 5949 4583 2... |
| 4 | 4269 7134 2614 1724 4464 1324 3370 3370 2106 2... |
数据分析
读取完训练集后,初步查看数据格式后,可以对数据集进行数据分析的操作。
读取了所有的训练集数据,从下面几个角度对数据集进行数据分析:
- 赛题数据中,新闻文本的长度是多少?
- 赛题数据中,字符分布是怎么样的?
- 赛题数据的类别分布是怎么样的,哪些类别比较多?
- 赛题数据中,不同类别的文本长度分布如何?
- 赛题数据中,不同类别的字符分布是怎么样的?
统计数据集中所有句子所包含字符的平均个数
由上面的表格可以知道,训练集的每行句子的字符使用空格进行隔开,所以可以分割,然后统计单词的个数来得到每个句子的长度。
%pylab inline |
Populating the interactive namespace from numpy and matplotlib count 200000.000000 mean 907.207110 std 996.029036 min 2.000000 25% 374.000000 50% 676.000000 75% 1131.000000 max 57921.000000 Name: text_len, dtype: float64
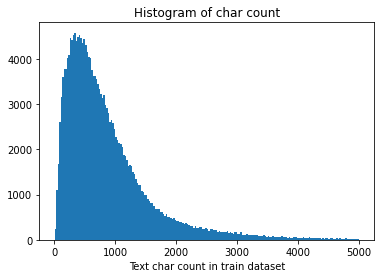
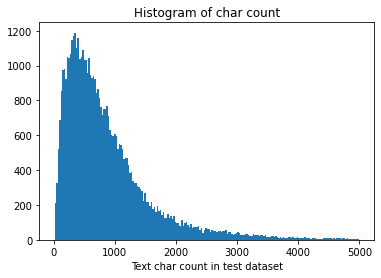
对新闻句子的统计可以得出,赛题的训练数据总共20w条,给定的文本比较长,每个句子平均由907个字符构成,最短的句子长度为2,最长的句子长度为57921。其中75%以下的数据长度在1131以下。
下图将句子长度绘制了直方图,可见大部分训练集的句子的长度都几种在2000以内。
_ = plt.hist(train_df['text_len'], bins=200) |
Text(0.5, 1.0, 'Histogram of char count')
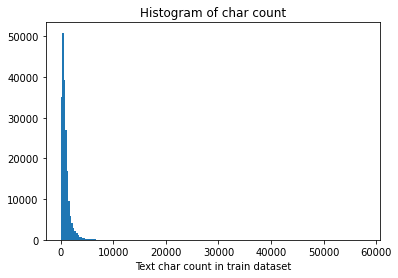
_ = plt.hist(train_df[train_df['text_len']<5000]['text_len'], bins=200) |
Text(0.5, 1.0, 'Histogram of char count')
同样统计测试集文本长度:
%pylab inline |
Populating the interactive namespace from numpy and matplotlib count 50000.000000 mean 909.844960 std 1032.313375 min 14.000000 25% 370.000000 50% 676.000000 75% 1133.000000 max 41861.000000 Name: text_len, dtype: float64
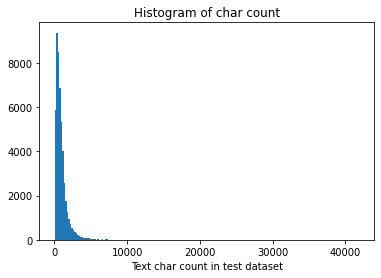
可见测试集共50,000条新闻,每条新闻平均909个字符,最短句子长度为14,最长句子41861,75%以下的数据长度在1133以下。
将测试集句子长度绘制了直方图:
_ = plt.hist(test_df['text_len'], bins=200) |
Text(0.5, 1.0, 'Histogram of char count')
_ = plt.hist(test_df[test_df['text_len']<5000]['text_len'], bins=200) |
Text(0.5, 1.0, 'Histogram of char count')
可以看到训练集和测试集的文本长度分布接近。
字符分布统计
接下来可以统计每个字符出现的次数,首先可以将训练集中所有的句子进行拼接进而划分为字符,并统计每个字符的个数。
从统计结果中可以看出,在训练集中总共包括6869个字,其中编号3750的字出现的次数最多,编号3133的字出现的次数最少。
from collections import Counter |
6869 ('3750', 7482224) ('3133', 1)
还可以根据字在语料中的出现情况,反推出标点符号。下面代码统计了不同字符在句子中出现的次数,其中字符3750,字符900和字符648在20w新闻的覆盖率接近99%,很有可能是标点符号。
from collections import Counter |
('3750', 197997) ('900', 197653) ('648', 191975)
同样统计一下测试集的字符分布:
from collections import Counter |
6203 ('3750', 1879488) ('1224', 1)
from collections import Counter |
('3750', 49455) ('900', 49366) ('648', 47966)
统计数据集中类别分布的规律
接下来对数据集的类别进行分布统计,具体统计每类新闻的样本个数。 标签和对应的类别为: {'科技': 0, '股票': 1, '体育': 2, '娱乐': 3, '时政': 4, '社会': 5, '教育': 6, '财经': 7, '家居': 8, '游戏': 9, '房产': 10, '时尚': 11, '彩票': 12, '星座': 13}
label2id={'科技': 0, '股票': 1, '体育': 2, '娱乐': 3, '时政': 4, '社会': 5, '教育': 6, |
Text(0.5, 0, 'category')
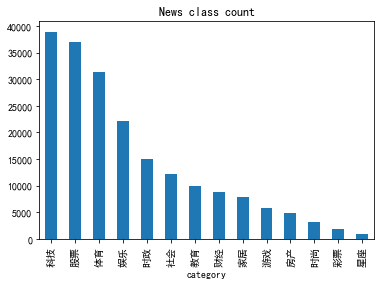
从统计结果可以看出,赛题的数据集类别分布存在较为不均匀的情况。在训练集中科技类新闻最多,其次是股票类新闻,最少的新闻是星座新闻。
统计数据集中不同类别下句子平均字符的个数
再统计一下训练集中不同类别下句子平均长度。
from collections import Counter |
Text(0.5, 0, 'category')
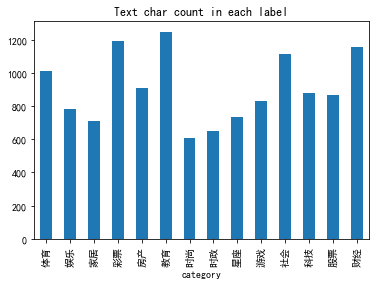
可以看到各个类别的平均句子长度,教育类、caipiao的句子长度最长,时尚类的比较短。 #### 统计数据集中不同类别下句子中最常见的5个字符
from collections import Counter |
word_count_df_each_label=pd.DataFrame.from_dict(word_count_each_label,orient='index').T |
| 体育 | 娱乐 | 家居 | 彩票 | 房产 | 教育 | 时尚 | 时政 | 星座 | 游戏 | 社会 | 科技 | 股票 | 财经 | |
|---|---|---|---|---|---|---|---|---|---|---|---|---|---|---|
| 0 | (3750, 1458331) | (3750, 774668) | (3750, 242367) | (3750, 87412) | (3750, 180259) | (3750, 469540) | (3750, 83834) | (3750, 360839) | (3750, 33796) | (3750, 178783) | (3750, 715740) | (3750, 1267331) | (3750, 1200686) | (3750, 428638) |
| 1 | (648, 974639) | (648, 494477) | (648, 202399) | (4464, 51426) | (648, 114512) | (648, 345372) | (648, 67353) | (648, 231863) | (648, 26867) | (648, 157291) | (648, 329051) | (648, 967653) | (648, 714152) | (648, 262220) |
| 2 | (900, 618294) | (900, 298663) | (900, 92207) | (3370, 45815) | (900, 75185) | (900, 222488) | (900, 37240) | (900, 190842) | (900, 11263) | (900, 70680) | (900, 305241) | (900, 577742) | (3370, 626708) | (900, 184131) |
| 3 | (7399, 351894) | (6122, 187933) | (6122, 57345) | (648, 37041) | (3370, 67780) | (6248, 193757) | (4939, 18591) | (4411, 120442) | (4939, 9651) | (7328, 46477) | (6122, 159125) | (3370, 503768) | (900, 542884) | (3370, 159156) |
| 4 | (6122, 343850) | (4939, 173606) | (4939, 56147) | (2465, 36610) | (2465, 45163) | (2555, 175234) | (6122, 18438) | (7399, 86190) | (669, 8925) | (6122, 43411) | (5598, 136713) | (4464, 307431) | (4464, 445525) | (5296, 132136) |
假设字符3750,字符900和字符648是句子的标点符号,请分析赛题每篇新闻平均由多少个句子构成?
利用re正则表达式实现多个字符对一个字符串进行分割。
import re |
count 200000.000000 mean 80.802370 std 86.955448 min 1.000000 25% 29.000000 50% 57.000000 75% 103.000000 max 3460.000000 Name: sentence_count, dtype: float64
可以看到平均每个文本都由80个句子组成。
数据分析的结论
通过上述分析可以知道数据集的大致状况:
- 赛题中每个新闻包含的字符个数平均为1000个,还有一些新闻字符较长;
- 赛题中新闻类别分布不均匀,科技类新闻样本量接近4w,星座类新闻样本量不到1k;
- 赛题总共包括7000-8000个字符;
还可以得出以下对训练有价值的结论:
- 每个新闻平均字符个数较多,可能需要截断;
- 由于类别不均衡,会严重影响模型的精度。